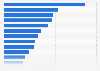
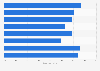
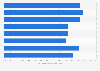
| Characteristic | Number of productions |
|---|---|
| - | - |
| - | - |
| - | - |
| - | - |
| - | - |
| - | - |
| - | - |
| - | - |
The chart is not accessible to screen readers. Please switch to the table view to access the data.
November 2015
United Kingdom
2014
* Data presents UK Theatre (formerly The Theatrical Management Association or TMA) member venues (over 200 venues). The venues are not representative of all theatres and concert halls in the UK, and due to membership fees the sample contains a higher proportion of better resourced theatres. A list of venues (by venue type) is included within the report
The source adds the following additional information:
"It should be noted that the data presented in this report still does not represent 100% of tickets sales in all UK Theatre venues. A few venues do not take part in the scheme and some venues do not complete returns every week. We estimate that in 2014 we captured around 90% of activity at UK Theatre who are not members or affiliate members of the Society of London Theatre (SOLT). Most organisations who are members of both only provide returns to SOLT. A very small number supply both. Only 1% of tickets sold in the UK Theatre sample in 2014 also appear in SOLT鈥檚 statistics for the year."