
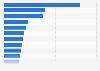

| Characteristic | Percentage of application visits |
|---|---|
| - | - |
| - | - |
| - | - |
| - | - |
| - | - |
The chart is not accessible to screen readers. Please switch to the table view to access the data.
Download
Source
Source
Release date
December 2014
More information
Region
France
Survey time period
October 1 to October 31, 2014
Number of respondents
692 respondents
Special properties
applications
Supplementary notes
* Average indicator.
The source does not provide any information regarding missing percentage points to 100 percent.
Citation formats