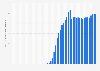
| Characteristic | Mobile connections in millions |
|---|---|
| '23 | 185.02 |
| '22 | 169 |
| '21 | 161.31 |
| '20 | 150 |
| '19 | 140.72 |
| '18 | 134.52 |
| '17 | 132.28 |
| '16* | 129.87 |
| '15 | 113.83 |
| '14 | 112.63 |
| '13 | 115.23 |
| '12 | 113.16 |
| '11 | 114.13 |
| '10 | 108.85 |
| '09 | 108.26 |
| '08 | 107.25 |
| '07 | 97.15 |
| '06 | 85.65 |
| '05 | 79.27 |
| '04 | 71.32 |
| '03 | 64.84 |
| '02 | 59.13 |
| '01 | 56.13 |
| '00 | 48.25 |
| '99 | 23.47 |
| '98 | 13.91 |
| '97 | 8.29 |
| '96 | 5.55 |
| '95 | 3.76 |
| '94 | 2.48 |
| '93 | 1.77 |
| '92 | 0.95 |
The chart is not accessible to screen readers. Please switch to the table view to access the data.
Loading statistic...
Download
Source
Source
Release date
March 2024
More information
Region
Germany
Survey time period
1992 to 2023
Supplementary notes
According to the source, the actual number of SIM cards circulating may exceed the figures taken from company reports. Additionally, it should be kept in mind that the increased popularity of secondary and tertiary phones over the last years resulted in some SIM cards not being used for longer periods of time.
* The source adds the following information: "The increase in number of mobile phone connections is due to a change in counting methodology by Vodafone." Until 2015 only direct Vodafone customers were taken into consideration.
Citation formats