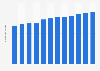
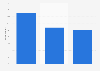
| Characteristic | Number of trips in millions |
|---|---|
| - | - |
| - | - |
| - | - |
| - | - |
| - | - |
| - | - |
The chart is not accessible to screen readers. Please switch to the table view to access the data.
Download
Source
Sources
Release date
April 2016
More information
Region
Germany
Survey time period
2011 to 2015
Number of respondents
13,000*
Special properties
Suppliers and organizers in the meetings and events industry
Method of interview
Online survey
Supplementary notes
* For the 2015/16 report, the survey was conducted in February 2016 and included 3,500 event venues/suppliers in Germany (with more than 100 seating places in the largest room) and ca. 9,500 meeting and event organizers (companies, associations and agencies) worldwide.
Citation formats