| Characteristic | Index rating |
|---|---|
| - | - |
| - | - |
| - | - |
| - | - |
| - | - |
| - | - |
| - | - |
| - | - |
| - | - |
| - | - |
| - | - |
| - | - |
| - | - |
| - | - |
| - | - |
| - | - |
| - | - |
| - | - |
| - | - |
| - | - |
| - | - |
| - | - |
| - | - |
| - | - |
| - | - |
The chart is not accessible to screen readers. Please switch to the table view to access the data.
Download
Source
Source
Release date
May 2015
More information
Region
Europe
Survey time period
2015
Supplementary notes
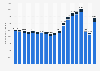
Quality of use was calculated as a combination of punctuality of regional trains, punctuality of long-distance trains, percentage of high-speed rail, and average fare per passenger-kilometre.
The source provides the following information regarding calculation methodology:
Each dimension comprises at least two subdimensions, and all were given equal weight. We rescaled the data to represent a score out of ten for each subdimension. To create the index, we then combined the ratings for each dimension and subdimension based on their weighting.
Citation formats