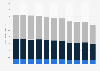
| Characteristic | Cable | IPTV | DTH and MDS | Reporting BDU total |
|---|---|---|---|---|
| - | - | - | - | - |
| - | - | - | - | - |
| - | - | - | - | - |
| - | - | - | - | - |
| - | - | - | - | - |
| - | - | - | - | - |
| - | - | - | - | - |
| - | - | - | - | - |
The chart is not accessible to screen readers. Please switch to the table view to access the data.
Download
Source
Source
Release date
November 2017
More information
Region
Canada
Survey time period
2009 to 2016
Supplementary notes
Monthly revenues per subscriber are calculated by dividing the annual BDU revenues from basic and non-basic services by the average number of subscriptions in the year. The result is then divided by 12 to obtain the monthly amount. The average number of subscribers is determined by dividing the sum of the number of subscribers at the beginning and at the end of the year by two.
Figures for periods before 2011 come from previous reporting.
Citation formats