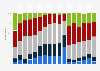
| Characteristic | Very concerned | Fairly concerned | Not very concerned | Not at all concerned | Don't know |
|---|---|---|---|---|---|
| 2012 | 27% | 45% | 20% | 6% | 3% |
| 2014 | 28% | 48% | 17% | 4% | 3% |
| 2016 | 22% | 43% | 23% | 8% | 3% |
| 2018 | 24% | 47% | 20% | 6% | 3% |
| 2020 | 23% | 41% | 22% | 8% | 6% |
| 2022 | 56% | 31% | 7% | 2% | 4% |
The chart is not accessible to screen readers. Please switch to the table view to access the data.
June 2023
United Kingdom
June 2012; March 2014 to March 2020; Summer 2022
4,472 respondents
16 years and older
UK households
Online survey
* Originally asked as ''And still thinking about the next 10-20 years, how concerned, if at all, are you about...''
Survey base varied across the survey cycles.
Survey methodology up to 2018 was a Kantar face-to-face omnibus survey. In 2021, a temporary Kantar online panel type of survey was introduced, which was not based on a random sample of respondents. In 2022, an address based online survey (ABOS) was used. Due to a change in survey methodology, the source states that direct comparisons between time series is not possible.
From 1012 to 2022, the survey was conducted by the Department for Business, Energy and Industrial Strategy (BEIS), whereas in 2023 it was carried out by the newly created Department for Energy Security and Net Zero (DESNZ).
This statistic using original data from the Department for Business, Energy and Industrial Strategy and the Department for Energy Security and Net Zero includes copyright material licensed under 漏 Crown, the