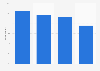
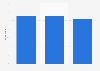
| Characteristic | Average net premium |
|---|---|
| - | - |
| - | - |
| - | - |
| - | - |
| - | - |
| - | - |
| - | - |
| - | - |
The chart is not accessible to screen readers. Please switch to the table view to access the data.
February 2018
United Kingdom (Great Britain)
November 30, 2017 to December 8, 2017
8,060*
Online interview
* The source does not give a breakdown of the number of respondents per country.
The research considered eight categories (general food products, alcoholic beverages, soft drinks, fashion items, high precision tools, automotives, homewares and air travel) to estimate the premium commanded on products labeled as made in Britain, England, Scotland and/or Wales in comparison to unlabelled products.
The results shown in this statistic are net results, which take into account that some consumers have a negative and indifferent perceptions of British-made products. For more information, please see page 8 of the report.