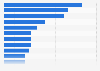
| Characteristic | Number of employees |
|---|---|
| - | - |
| - | - |
| - | - |
| - | - |
| - | - |
| - | - |
| - | - |
| - | - |
| - | - |
| - | - |
| - | - |
| - | - |
| - | - |
| - | - |
| - | - |
| - | - |
| - | - |
| - | - |
| - | - |
| - | - |
| - | - |
| - | - |
| - | - |
| - | - |
| - | - |
| - | - |
The chart is not accessible to screen readers. Please switch to the table view to access the data.
Download
Source
Sources
Release date
October 2014
More information
Region
Worldwide
Survey time period
2013
Special properties
WGC member companies
Supplementary notes
* This statistic is based on a survey including data from 15 companies with operations in over 25 countries with a total of over 160,000 employees and contractors. The operations reflected in this survey cover 732 metric tons, representing 24 percent. While this is considered a representative sample, it is only part of the picture and the actual total global impact of gold mining is much greater than shown in this report.
Citation formats