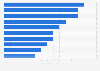
| Characteristic | Applications per million inhabitants |
|---|---|
| - | - |
| - | - |
| - | - |
| - | - |
| - | - |
| - | - |
| - | - |
| - | - |
| - | - |
| - | - |
| - | - |
| - | - |
| - | - |
| - | - |
| - | - |
| - | - |
| - | - |
| - | - |
| - | - |
| - | - |
The chart is not accessible to screen readers. Please switch to the table view to access the data.
Download
Source
Sources
Release date
June 2021
More information
Region
Worldwide
Survey time period
2020
Supplementary notes
* Country of residence of the first named applicant. Countries listed made up the 20 countries with the highest such ratio.
Citation formats