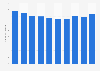
| Characteristic | Million tons of CO2 equivalent |
|---|---|
| 2024 | 707.61 |
| 2023 | 742.85 |
| 2022 | 806.87 |
| 2021 | 807.72 |
| 2020 | 778.62 |
| 2019 | 839.1 |
| 2018 | 908.32 |
| 2017 | 900.06 |
| 2016 | 910.45 |
| 2015 | 905.19 |
| 2014 | 908.61 |
| 2013 | 941.08 |
| 2012 | 914.74 |
| 2011 | 918.06 |
| 2010 | 944.56 |
| 2009 | 904.1 |
| 2008 | 962.77 |
The chart is not accessible to screen readers. Please switch to the table view to access the data.
Loading statistic...
Download
Source
Sources
Release date
June 2026
More information
Region
Germany
Survey time period
2008 to 2024
Supplementary notes
All sectors excluding memo items.
According to the source, "The European Union (EU) as a party to the United Nations Framework Convention on Climate Change (UNFCCC) reports annually its greenhouse gas inventory for the year t-2 and within the area covered by its Member States. The inventory contains data on carbon dioxide (CO2), methane (CH4), nitrous oxide (N2O), perfluorocarbons (PFCs), hydrofluorocarbons (HFCs), sulphur hexafluoride (SF6) and nitrogen trifluoride (NF3). The EU inventory is fully consistent with national greenhouse gas inventories compiled by the EU Member States."
Citation formats