| Year | Sales per store in thousand U.S. dollars |
|---|---|
| - | - |
| - | - |
| - | - |
| - | - |
| - | - |
| - | - |
| - | - |
| - | - |
| - | - |
| - | - |
| - | - |
The chart is not accessible to screen readers. Please switch to the table view to access the data.
Download
Source
Source
Release date
March 2021
More information
Region
Worldwide
Survey time period
2010 to 2020
Supplementary notes
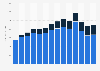
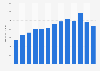
Net sales per store represents net sales, including ecommerce sales, for the period divided by the average number of stores open during the period. For purposes of this calculation, the average number of stores open during the period is equal to the sum of the number of stores open as of the end of each month during the fiscal year divided by the number of months in the fiscal year.
Citation formats