| Characteristic | Commute time in minutes* |
|---|---|
| - | - |
| - | - |
| - | - |
| - | - |
| - | - |
| - | - |
| - | - |
| - | - |
| - | - |
| - | - |
The chart is not accessible to screen readers. Please switch to the table view to access the data.
Download
Source
Sources
Release date
November 2014
More information
Region
Canada, United States
Survey time period
as of November 2014
Supplementary notes
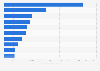
* Getting to and from the airport: Google Maps data was used to determine the driving time (50 percent weight) and the public transportation time (50 percent weight) to and from the airport to the airport's primary city center for the busiest 50 airports in the U.S. and ten in Canada during the morning and evening rush hours.
Citation formats