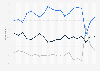
| Characteristic | Over 20 percent increase | 5 to 20 percent increase | 5 percent increase to 5 percent decrease | 5 to 20 percent decrease | Over 20 percent decrease |
|---|---|---|---|---|---|
| - | - | - | - | - | - |
| - | - | - | - | - | - |
| - | - | - | - | - | - |
| - | - | - | - | - | - |
| - | - | - | - | - | - |
| - | - | - | - | - | - |
| - | - | - | - | - | - |
| - | - | - | - | - | - |
| - | - | - | - | - | - |
| - | - | - | - | - | - |
| - | - | - | - | - | - |
The chart is not accessible to screen readers. Please switch to the table view to access the data.
Download
Source
Sources
Release date
June 2018
More information
Region
China
Survey time period
2008 to 2018
Number of respondents
499 European companies in the most recent survey
Method of interview
Questionnaire
Supplementary notes
*Figures are based on respondents' answers to the following survey question: "How did your business's total last year's revenue in Mainland China evolve compared to a year earlier?"
Figures may not sum up to 100 percent due to rounding.
The panel size varied for each year.
Citation formats