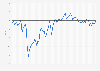
| Characteristic | Down >20% | Down 11-20% | Down 1-10% | Remains the same | Up 1-10% | Up 11-20% | Up 21-50% | Up >50% |
|---|---|---|---|---|---|---|---|---|
| - | - | - | - | - | - | - | - | - |
| - | - | - | - | - | - | - | - | - |
| - | - | - | - | - | - | - | - | - |
| - | - | - | - | - | - | - | - | - |
| - | - | - | - | - | - | - | - | - |
| - | - | - | - | - | - | - | - | - |
The chart is not accessible to screen readers. Please switch to the table view to access the data.
Download
Source
Sources
Release date
September 2021
More information
Region
China, United States
Survey time period
2016 to 2021
Number of respondents
332 companies
Method of interview
Questionnaire
Supplementary notes
Original survey question: "How does your estimated 2021 China revenue compare to your 2020 results?"
Surveyed American companies were AmCham China and AmCham Shanghai member companies in China.
Percentages may not total 100 due to rounding.
Citation formats