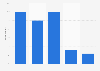
| Characteristic | Tea Party Republicans | Other Republicans | Non-Republicans |
|---|---|---|---|
| Situation with Islamic militants in Iraq and Syria | 57% | 51% | 34% |
| Federal budget deficit | 55% | 40% | 31% |
| The way the federal governmentis working | 48% | 39% | 42% |
| The economy | 47% | 40% | 43% |
| Taxes | 42% | 35% | 25% |
| Immigration | 42% | 35% | 26% |
| Affordable Care Act | 41% | 30% | 30% |
| Foreign affairs | 40% | 34% | 25% |
| Availability of good jobs | 39% | 43% | 47% |
| The way income and wealth are distributed | 24% | 22% | 26% |
| Abortion and access to controception | 15% | 22% | 43% |
| Equal pay for women | 15% | 22% | 43% |
| Climate change | 7% | 9% | 26% |
The chart is not accessible to screen readers. Please switch to the table view to access the data.
Loading statistic...
Download
Source
Source
Release date
October 2014
More information
Region
United States
Survey time period
September 25 - 30, 2014
Number of respondents
1,252 respondents
Age group
18 years and older
Special properties
Participants living in all 50 U.S. stated and the District of Columbia
Method of interview
Telephone interview
Supplementary notes
This question was phrased by the source as follows: "How important will each of the following issues be to your vote for Congress this year -- will it be -- extremely important, very important, moderately important, or not that important?"
Citation formats