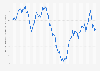
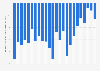
| Characteristic | Net balance of responses in percentage points of total answers* |
|---|---|
| - | - |
| - | - |
| - | - |
| - | - |
| - | - |
| - | - |
| - | - |
| - | - |
| - | - |
| - | - |
| - | - |
| - | - |
| - | - |
| - | - |
| - | - |
| - | - |
| - | - |
| - | - |
| - | - |
| - | - |
| - | - |
| - | - |
| - | - |
| - | - |
| - | - |
| - | - |
| - | - |
| - | - |
| - | - |
| - | - |
| - | - |
| - | - |
| - | - |
| - | - |
| - | - |
| - | - |
| - | - |
| - | - |
| - | - |
| - | - |
| - | - |
| - | - |
| - | - |
The chart is not accessible to screen readers. Please switch to the table view to access the data.
Download
Source
Source
Release date
October 2024
More information
Region
Poland
Survey time period
January 2020 and July 2023
Number of respondents
32,000*
Special properties
consumers
Supplementary notes
*Refers to total number of respondents surveyed across the European Union (EU-27) during the last period. The source specifies that the sample size for each country varies according to the heterogeneity of their economies and is positively related to their respective population size.
The original question (in English) is posed as follows: "How has the financial situation of your household changed over the last 12 months?"
The data is seasonally adjusted and published as a net balance i.e. the difference between positive and negative answers (in percentage points of total answers).
Citation formats