| Characteristic | Percentage difference* |
|---|---|
| - | - |
| - | - |
| - | - |
| - | - |
| - | - |
| - | - |
| - | - |
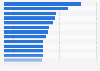
The chart is not accessible to screen readers. Please switch to the table view to access the data.
December 2018
United Kingdom
2017
* Data has been calculated from Eurostat price level indices, where 100 = EU28 average.
Price level differences express the price level of a given country relative to another, or relative to a group of countries like the EU-28 and are calculated using purchasing power parities. An understanding of the differences in price levels is important in the comparison of economic data, such as gross domestic product (GDP). Observing price level differences is also important in the analysis of the development of the EU's single market for goods and services.
Data coverage corresponds to code prc_ppp_ind of the purchasing power parities (PPPs), price level indices and real expenditures for ESA 2010 aggregates.