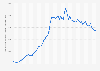
| Characteristic | 2015 | 2016 |
|---|---|---|
| Austria | 9.8 | 8.4 |
| Belgium | 8.2 | 6.9 |
| Croatia | 14.1 | 16 |
| Cyprus | 18.9 | 16.5 |
| Czechia | 14.2 | 12.3 |
| Denmark | 4.8 | 6.3 |
| England | 6.3 | 7.3 |
| Estonia | 18.3 | - |
| Finland | 5.8 | 5.3 |
| France | 7 | 8.4 |
| Germany | 6.6 | 6 |
| Great Britain | 6.4 | 7 |
| Greece | 11.8 | 13.8 |
| Hungary | 15.1 | 15.5 |
| Irish Republic | 7.1 | 7.4 |
| Italy | 9.9 | 9.4 |
| Latvia | 31.7 | 27.9 |
| Lithuania | 27.7 | 25.3 |
| Luxembourg | 12.4 | 13.9 |
| Netherlands | 3.6 | 2.6 |
| Northern Ireland | 10.3 | 8.1 |
| Norway | 2.3 | 2.9 |
| Poland | 24.1 | 22.9 |
| Portugal | 14.1 | 11.9 |
| Romania | 32.7 | 36.3 |
| Scotland | 7.6 | 5.9 |
| Slovenia | 7.8 | 10.7 |
| Spain | 7.9 | 8.4 |
| Sweden | 2.9 | 4.3 |
| Switzerland | 7 | 6 |
| United Kingdom | 6.6 | 7.1 |
| Wales | 6.8 | 4.5 |
The chart is not accessible to screen readers. Please switch to the table view to access the data.
March 2018
United Kingdom
2015 and 2016
In accordance with the commonly agreed international definition, most countries define a fatality as one being due to a road accident where death occurs within 30 days of the accident. The official road accident statistics of some countries however, limit the fatalities to those occurring within shorter periods after the accident. Numbers of deaths and death rates in the above table have been adjusted according to the factors used by the Economic Commission for Europe and the International Transport Forum (ITF) (formerly known as ECMT) to represent standardised 30-day deaths: Italy (7 days) +8%; France (6 days) +5.7%; Portugal (1 day) +14%; Republic of Korea (3 days) +15%.