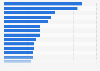
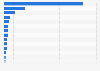
| Characteristic | Net inflows as share of 2012 AuM |
|---|---|
| - | - |
| - | - |
| - | - |
| - | - |
| - | - |
| - | - |
| - | - |
| - | - |
| - | - |
| - | - |
| - | - |
| - | - |
| - | - |
| - | - |
| - | - |
| - | - |
The chart is not accessible to screen readers. Please switch to the table view to access the data.
Download
Source
Sources
Release date
July 2014
More information
Region
Worldwide
Survey time period
2013
Special properties
Net inflows to asset management sector globally in 2013 as share of 2012 assets under management, by financial instrument.
Supplementary notes
The source adds the following information: "Sizing corresponds to assets under management (AuM) sourced from each region and professionally managed in exchange for a fee. Assets under management include captive AuM of insurance groups or pension funds if those assets are delegated to asset management entities with fees paid."
Citation formats