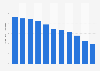
| Characteristic | Scores of 0 to 10, (10 being the best) |
|---|---|
| - | - |
| - | - |
| - | - |
| - | - |
| - | - |
| - | - |
| - | - |
| - | - |
| - | - |
| - | - |
| - | - |
The chart is not accessible to screen readers. Please switch to the table view to access the data.
October 2018
United Kingdom (Scotland)
2018
Scores are measured using thefollowing criteria:
Income: Household disposable income per capita (in real USD PPP)
Jobs: Employment rate (%) Unemployment rate (%)
Housing: Number of rooms per person (ratio)
Health: Life expectancy at birth (years) Age adjusted mortality rate (per 1 000 people)
Education: Share of labour force with at least secondary education (%)
Environment: Estimated average exposure to air pollution in PM2.5 (碌g/m鲁), based on satellite imagery data
Safety: Homicide rate (per 100 000 people)
Civic engagement: voter turnout (%)
Accessibility of services: Share of households with broadband access (%)
Community: Percentage of people who have friends or relatives to rely on in case of need
Life satisfaction: Average self-evaluation of life satisfaction on a scale from 0 to 10