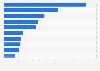
| Brand name | Twitter TV unique audience (in 1,000s) | Twitter TV impressions (in 1,000s) |
|---|---|---|
| - | - | - |
| - | - | - |
| - | - | - |
| - | - | - |
| - | - | - |
| - | - | - |
| - | - | - |
| - | - | - |
| - | - | - |
| - | - | - |
Download
Source
Source
Release date
February 2014
More information
Region
Worldwide
Survey time period
as of February 2014
Supplementary notes
The source provides the following information: "Twitter TV activity was collected on a +/- three hour capture window around the linear airing time of the TV event. Brands include those that placed ads in the live TV event. Reach metrics (unique audience, impressions) were measured from when the Tweets were sent until the end of the broadcast day at 5 a.m. Data includes only those brands measured by TV Brand Effect."
Citation formats