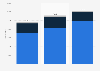
| Characteristic | Volume of registered HGVs |
|---|---|
| Q2 2022 | 5,938 |
| 2021 | 6,187 |
| 2020 | 6,875 |
| 2019 | 8,107 |
| 2018 | 9,214 |
| 2017 | 10,344 |
| 2016 | 11,595 |
| 2015 | 12,531 |
| 2014 | 13,613 |
| 2013 | 14,618 |
| 2012 | 15,632 |
| 2011 | 16,752 |
| 2010 | 17,915 |
| 2009 | 18,482 |
| 2008 | 19,637 |
| 2007 | 20,748 |
| 2006 | 20,941 |
| 2005 | 17,448 |
| 2004 | 12,948 |
| 2003 | 8,741 |
| 2002 | 5,391 |
| 2001 | 1,727 |
The chart is not accessible to screen readers. Please switch to the table view to access the data.
Loading statistic...
Download
Source
Sources
Release date
May 2022
More information
Region
United Kingdom (Great Britain)
Survey time period
2001 to Q2 2022
Supplementary notes
Figures are as of the last quarter of each year and indicate the total number of registered heavy goods vehicles on the road in Great Britain.
Figures are for the last quarter of the year with the exception of 2022 data, which is from the second quarter.
Please choose the report def_veh0120_GB on the provided link to look at the original data.
This statistic using original data from the Government Digital Service and includes copyright material licensed under 漏 Crown, the
Citation formats