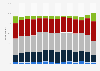
| Characteristic | Agree strongly | Agree | Neither agree nor disagree | Disagree | Disagree strongly |
|---|---|---|---|---|---|
| 2017 | 64% | 20% | 6% | 6% | 1% |
| 2016 | 62% | 21% | 7% | 8% | 1% |
| 2015 | 54% | 24% | 9% | 10% | 1% |
| 2014 | 61% | 24% | 5% | 7% | 1% |
| 2013 | 58% | 24% | 6% | 8% | 2% |
| 2012 | 68% | 19% | 4% | 7% | 1% |
| 2011 | 64% | 22% | 5% | 6% | 2% |
| 2010 | 60% | 25% | 5% | 8% | 1% |
| 2009 | 58% | 24% | 6% | 8% | 1% |
| 2008 | 61% | 22% | 5% | 8% | 1% |
| 2007 | 60% | 24% | 5% | 7% | 1% |
| 2006 | 58% | 24% | 6% | 8% | 1% |
The chart is not accessible to screen readers. Please switch to the table view to access the data.
Loading statistic...
Download
Source
Source
Release date
July 2018
More information
Region
United Kingdom (Great Britain)
Survey time period
2006 to 2017
Number of respondents
783*
Age group
18 years and older
Method of interview
Face-to-face interview
Supplementary notes
* Previous base values provided by the source.
**The original survey statement was "If someone has drunk any alcohol they should not drive".
Citation formats