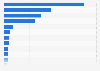
| Characteristic | Composite Loyalty Score* |
|---|---|
| - | - |
| - | - |
| - | - |
| - | - |
| - | - |
| - | - |
| - | - |
| - | - |
The chart is not accessible to screen readers. Please switch to the table view to access the data.
Download
Source
Source
Release date
April 2018
More information
Region
United States
Survey time period
April 2018
Number of respondents
approximately 11,500
Age group
18-65 years and older
Supplementary notes
*The Composite Loyalty Score was calculated by averaging consumer satisfaction ratings of their most recent dining experience and their likelihood to recommend that brand. The results were averaged to attain a Composite Loyalty Index score. Only chains that received at least 100 votes and representing 2% or more of votes were analyzed.
Citation formats