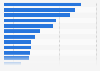
| Characteristic | Ever done | Past three months |
|---|---|---|
| August to October 2012 | 46% | 35% |
| November 2012 to January 2013 | 47% | 36% |
| March to May 2013 | 43% | 34% |
| March to May 2015 | 42% | 34% |
| March to May 2016 | 44% | 35% |
| March to May 2017 | 46% | 37% |
| March 2018 | 41% | 33% |
The chart is not accessible to screen readers. Please switch to the table view to access the data.
Loading statistic...
Download
Source
Sources
Release date
July 2018
More information
Region
United Kingdom
Survey time period
August 2012 to May 2018
Number of respondents
4,526**
Age group
12 years and older
Special properties
among internet users
Supplementary notes
* Consumed includes streaming, accessing and downloading.
** Base of most recent survey wave (Wave 8). Base varied by wave: n (W2) = 4,728; n (W3) = 4,708; n (W4) = 4,673; n(W5) = 4,552, n(W6) = 4,670, n(W7) = 4,573.
Online (CAWI) and face-to-face (CAPI) surveys were used.
The source does not provide detailed information regarding the question. The chosen wording here might therefore differ slightly from the survey.
Data for waves previous to Wave 8 published earlier by the source.
Citation formats