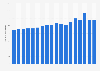
| Characteristic | Expenditure in GBP |
|---|---|
| - | - |
| - | - |
| - | - |
| - | - |
| - | - |
| - | - |
| - | - |
| - | - |
| - | - |
The chart is not accessible to screen readers. Please switch to the table view to access the data.
Download
Source
Source
Release date
December 2015
More information
Region
United Kingdom
Survey time period
2006 to 2014
Number of respondents
5,130 households**
Method of interview
Panel survey
Supplementary notes
*The figures have been deflated to 2014 prices to allow comparison across years in real terms. The categories of household expenditure this data is part of are based on the Classification of Individual Consumption by Purpose (COICOP) classification.
** Respondent household numbers varied from year to year:
2006: 6,650
2007: 6,140
2008: 5,850
2009: 5,830
2010: 5,260
2011: 5,690
2012: 5,600
2013: 5,140
2014: 5,130
Citation formats