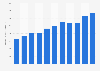
| Characteristic | Percentage change in expenditure* |
|---|---|
| - | - |
| - | - |
| - | - |
| - | - |
| - | - |
| - | - |
| - | - |
| - | - |
| - | - |
| - | - |
| - | - |
| - | - |
| - | - |
The chart is not accessible to screen readers. Please switch to the table view to access the data.
Download
Source
Source
Release date
March 2024
More information
Region
United Kingdom
Survey time period
2011 to 2023
Supplementary notes
* Percentage change (year on previous year) of household final consumption expenditure based on chained volume measures, reference year 2019 (seasonally adjusted). Expenditure based on volume terms rather than value terms to give a better picture of whether households purchased more or less goods and services over the period in consideration. Includes consumer spending on tourism (UK and foreign), food and drink, clothing, housing, household goods and services, health, transport, communication, education, restaurants, hotels and communication.
Data for years prior to 2023 were taken from previous publications by the source.
Citation formats