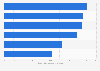
| Characteristic | Cesarean sections per 1,000 live births |
|---|---|
| Turkey | 615.1 |
| South Korea | 610.6 |
| Greece | 580.6 |
| Mexico | 520.1 |
| Chile* | 518.1 |
| Poland | 431.5 |
| Ireland | 385.6 |
| Portugal | 379 |
| Australia | 378.1 |
| Hungary | 366.7 |
| United Kingdom | 364.1 |
| Switzerland | 333 |
| United States* | 321.2 |
| Italy | 320.5 |
| Austria | 318.8 |
| Germany | 318.2 |
| Canada | 314.6 |
| Slovak Republic | 312.8 |
| New Zealand | 303.4 |
| Luxembourg | 295.3 |
| Czechia | 254.1 |
| Costa Rica | 253.8 |
| Spain | 247.4 |
| Latvia | 234.2 |
| Lithuania | 225.2 |
| Belgium | 223.6 |
| Slovenia | 219.4 |
| France | 210.8 |
| Estonia | 207 |
| Finland | 204.2 |
| Denmark | 203.2 |
| Sweden | 185.3 |
| Norway | 160 |
| Netherlands | 158.7 |
| Israel | 151.3 |
| Iceland | 141.8 |
The chart is not accessible to screen readers. Please switch to the table view to access the data.
Loading statistic...
Download
Source
Source
Release date
November 2025
More information
Region
OECD
Survey time period
2023 or latest year available
Supplementary notes
Release date represents the date figures were accessed.
*For these countries the "Inpatient procedures per 1 000 live births" was used as no data was available for "total procedures per 1 000 live births"
Citation formats