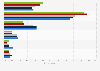
| Characteristic | Time spent in hours |
|---|---|
| - | - |
| - | - |
| - | - |
| - | - |
| - | - |
| - | - |
| - | - |
| - | - |
The chart is not accessible to screen readers. Please switch to the table view to access the data.
April 2016
United Kingdom
2007 to 2015***
654**
16 years and older
participants who played games at home or elsewhere
Computer-assisted personal interviews (CAPI)
* The original survey question was "Please think about the hours that you spend game playing in a typical week 鈥� so both weekdays and at the weekend... How many hours in a typical week would you say you play games?" (Unprompted responses)
** n (2007) = 843; n (2009) = 616; n (2010) = 668; n (2011) = 570; n (2012) = 551; n (2013) = 604; n (2014) = 743; n (2015) = 654.
*** September to October 2015 was the date of the most recent survey.
Data for years previous to 2013 were published earlier by the source.