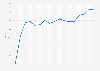
| Characteristic | Return on equity |
|---|---|
| 2024 | 11% |
| 2023 | 10.7% |
| 2022* | 10.2% |
| 2021 | 10% |
| 2020 | 7.6% |
| 2019 | 8.5% |
| 2018 | 8.2% |
| 2017 | 8.9% |
| 2016 | 9.3% |
| 2015 | 8.3% |
| 2014 | 7.7% |
| 2013 | 6.1% |
| 2012 | 8.9% |
| 2011 | 8.8% |
| 2010 | 12.3% |
| 2009 | 10.8% |
| 2008 | 6.6% |
| 2007 | 19.6% |
| 2006 | 21.2% |
| 2005 | 20.2% |
| 2004 | 16.8% |
| 2003 | 15.3% |
The chart is not accessible to screen readers. Please switch to the table view to access the data.
March 2025
Worldwide
2003 to 2024
Return on tangible equity is calculated by dividing net income attributable to equity holders (adjusted for interest on Undated super subordinated notes issued by BNP Paribas SA, treated as a dividend for accounting purposes and adjusted for the foreign exchange effect on redeemed Undated super subordinated notes) by average tangible permanent shareholders鈥� equity, not revalued, between the beginning of the year and the end of the year (shareholders鈥� equity attributable to equity holders adjusted for changes in assets and liabilities recognised directly in equity, Undated super subordinated notes, remuneration net of tax payable to holders of Undated super subordinated notes, the distribution project, intangible assets and goodwill).
* 2022 return on tangible equity calculated on the basis of reported 2022 results, i.e. net income, Group share of EUR 10,196 million.