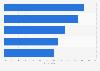
| Tax year | Tax contribution in billion GBP |
|---|---|
| - | - |
| - | - |
| - | - |
| - | - |
| - | - |
| - | - |
| - | - |
| - | - |
| - | - |
| - | - |
| - | - |
| - | - |
| - | - |
The chart is not accessible to screen readers. Please switch to the table view to access the data.
Download
Source
Source
Release date
January 2020
More information
Region
United Kingdom
Survey time period
2007 to 2019
Supplementary notes
Financial year to 31st of March.
* Data not provided for 2008.
The source adds further comments: "This ninth study has been carried out using data provided by 45 financial sector companies on all their UK tax payments. These companies include retail banks, investment banks, insurers, asset managers, real estate companies and other FS sector companies."
** estimated.
Citation formats