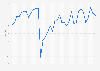
| Characteristic | Index |
|---|---|
| Q1 '11 | 12 |
| Q2 '11 | 0 |
| Q3 '11 | 0 |
| Q4 '11 | -3 |
| Q1 '12 | 15 |
| Q2 '12 | 23 |
| Q3 '12 | 17 |
| Q4 '12 | -11 |
| Q1 '13 | 9 |
| Q2 '13 | 16 |
| Q3 '13 | 25 |
| Q4 '13 | 24 |
| Q1 '14 | 45 |
| Q2 '14 | 47 |
| Q3 '14 | 49 |
| Q4 '14 | 58 |
| Q1 '15 | 71 |
| Q2 '15 | 64 |
| Q3 '15 | 59 |
| Q4 '15 | 54 |
| Q1 '16 | 67 |
| Q2 '16 | 64 |
| Q3 '16 | 68 |
| Q4 '16 | 80 |
| Q1 '17 | 100 |
| Q2 '17 | 95 |
| Q3 '17 | 106 |
| Q4 '17 | 103 |
| Q1 '18 | 107 |
| Q2 '18 | 106 |
| Q3 '18 | 118 |
| Q4 '18 | 129 |
| Q1 '19 | 106 |
| Q2 '19 | 129 |
| Q3 '19 | 136 |
| Q4 '19 | 142 |
| Q1 '20 | 132 |
| Q2 '20 | 48 |
| Q3 '20 | 60 |
| Q4 '20 | 72 |
The chart is not accessible to screen readers. Please switch to the table view to access the data.
December 2020
United States
2011 to 2020
The Wells Fargo/Gallup Small Business Index surveys small business owners on current and future perceptions of their business financial situation. Results are based on telephone interviews with small business owners in all 50 United States.
The Index is composed of two dimensions:
1. Owners鈥� ratings of the current economic situation of their businesses;
2. Owners鈥� ratings of how they expect their businesses to perform over the next 12 months.
The Index is computed using a formula that scores and sums the answers to 12 questions (six about the present situation and six about the future). An Index score of zero indicates a neutral view about the economic situation. The Small Business Index can range from -400 (most negative) to +400 (most positive).