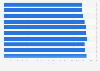
| Characteristic | Upper class | Middle class | Lower class |
|---|---|---|---|
| Very happy | 42% | 32% | 20% |
| Pretty happy | 48% | 48% | 46% |
| Not too happy | 10% | 18% | 31% |
| Don't know /refused | 1% | 1% | 2% |
The chart is not accessible to screen readers. Please switch to the table view to access the data.
Loading statistic...
Download
Source
Source
Release date
August 2012
More information
Region
United States
Survey time period
July 16-26, 2012
Number of respondents
2,508 respondents
Age group
18 years and older
Method of interview
Telephone interview
Supplementary notes
The source poses the original questions as follows: "Generally, how would you say things are these days in your life 鈥� would you say that you are very happy, pretty happy, or not too happy?"
Number of respondents per class:
Upper class = 507
Middle class = 1,287
Lower class = 670.
The source asked the respondents if they define themselves as lower, middle and upper class. For details, please see page 123 at the source.
Citation formats