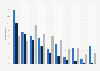
| Characteristic | Share of respondents |
|---|---|
| - | - |
| - | - |
| - | - |
| - | - |
| - | - |
| - | - |
| - | - |
| - | - |
| - | - |
| - | - |
The chart is not accessible to screen readers. Please switch to the table view to access the data.
Download
Source
Source
Release date
July 2012
More information
Region
United States
Survey time period
June 2012
Number of respondents
n = 510
Supplementary notes
* The original question posed by the source was:
"How likely would you be to watch any of these specific live events on your mobile access so you don鈥檛 miss a minute of the action?"
The respondents were 18 to 54 years of age.
Multiple answers were possible.
Citation formats