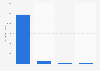
| Characteristic | Production in million metric tons |
|---|---|
| 2025/26 | 29.99 |
| 2024/25 | 29.44 |
| 2023/24 | 28.32 |
| 2022/23 | 27.71 |
| 2021/22 | 26.48 |
| 2020/21 | 25.47 |
| 2019/20 | 24.74 |
| 2018/19 | 24.4 |
| 2017/18 | 25.09 |
| 2016/17 | 24.87 |
| 2015/16 | 23.85 |
| 2014/15 | 22.19 |
| 2013/14 | 21.3 |
| 2012/13 | 20.27 |
| 2011/12 | 19.26 |
| 2010/11 | 17.79 |
| 2009/10 | 16.56 |
| 2008/09 | 16.59 |
| 2007/08 | 16.04 |
| 2006/07 | 15.87 |
| 2005/06 | 15 |
| 2004/05 | 14.25 |
| 2003/04 | 13.95 |
| 2002/03 | 13.18 |
| 2001/02 | 13.08 |
| 2000/01 | 8.96 |
The chart is not accessible to screen readers. Please switch to the table view to access the data.
Loading statistic...
Download
Source
Source
Release date
February 2026
More information
Region
Worldwide
Survey time period
2000/01 to 2025/26; Marketing year
Supplementary notes
* Forecast data.
The United States and Mexico are on a May-April marketing year. All other Northern Hemisphere countries are on a June-May marketing year. Southern Hemisphere producer countries of Argentina, Chile, and South Africa are on an October-September marketing year, and Australia, Brazil, and Peru are on a calendar year indicated as the second year of the split year.聽
Numbers have been rounded to provide a better understanding of the statistic.
Citation formats