


| Characteristic | Share of respondents |
|---|---|
| - | - |
| - | - |
| - | - |
| - | - |
| - | - |
| - | - |
| - | - |
| - | - |
The chart is not accessible to screen readers. Please switch to the table view to access the data.
Download
Source
Sources
Release date
June 2012
More information
Region
China
Survey time period
February 2012
Supplementary notes
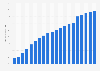
For this study, which took place in February 2012, 2,103 people who visited internet caf茅s at least once a month and spent at least an hour online were surveyed. In December 2011, moreover, mangers of 2,000 internet caf茅s were surveyed.
Percentage points over 100 percent are most likely due to rounding.
Citation formats



