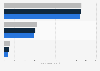
| Characteristic | Graduation rate |
|---|---|
| Iceland | 63.1% |
| Australia** | 49.8% |
| Poland | 49% |
| Finland | 48.5% |
| New Zealand | 47.6% |
| Denmark | 47.3% |
| Ireland | 45% |
| Norway | 43.4% |
| Netherlands | 42.8% |
| Portugal | 42.6% |
| Sweden | 39.9% |
| Slovak Republic | 38.9% |
| Japan | 38.8% |
| United Kingdom | 38.7% |
| United States | 36.5% |
| Italy | 35% |
| Czechia | 34.9% |
| Spain | 32.4% |
| Switzerland | 31.4% |
| Canada** | 30.6% |
| Hungary | 29.4% |
| Germany | 23.4% |
| Austria | 22.1% |
| Greece | 17.7% |
| Turkey** | 15.2% |
The chart is not accessible to screen readers. Please switch to the table view to access the data.
Loading statistic...
Download
Source
Source
Release date
June 2010
More information
Region
Worldwide
Survey time period
2007
Supplementary notes
*The graduate rate was calculated as the percentage of graduates to the population at the typical age of graduation.
** The values for Canada, Australia and Turkey were taken from 2006 as there was no available data for 2007.
The source provides no data for Belgium, France, Korea, Luxembourg, Mexico.
Citation formats