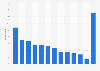
| Characteristic | Percent of newshole |
|---|---|
| - | - |
| - | - |
| - | - |
| - | - |
| - | - |
| - | - |
| - | - |
| - | - |
| - | - |
| - | - |
| - | - |
| - | - |
| - | - |
| - | - |
| - | - |
The chart is not accessible to screen readers. Please switch to the table view to access the data.
December 2011
United States
2011
* The percentages are based on "newshole," or the space devoted to each subject in print and online and time on radio and TV.
The reason that a running news story, such as the faltering economy and the debates over what to do about it, can be the No. 1 story of the year, but not the No. 1 topic is because topic is broader.
PEJ鈥檚 weekly News Coverage Index examines the news agenda of 52 different outlets from five sectors of the media: print, online, network TV, cable and radio. The weekly study is designed to provide news consumers, journalists and researchers with hard data about what stories and topics the media are covering, the trajectories of that media narrative and differences among news platforms.