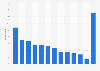
| Characteristic | Percent of newshole |
|---|---|
| - | - |
| - | - |
| - | - |
| - | - |
| - | - |
| - | - |
| - | - |
| - | - |
| - | - |
| - | - |
The chart is not accessible to screen readers. Please switch to the table view to access the data.
Download
Source
Source
Release date
January 2010
More information
Region
United States
Survey time period
2009
Supplementary notes
* The percentages are based on "newshole," or the space devoted to each subject in print and online and time on radio and TV.
PEJ鈥檚 weekly News Coverage Index examines the news agenda of 52 different outlets from five sectors of the media: print, online, network TV, cable and radio. The weekly study is designed to provide news consumers, journalists and researchers with hard data about what stories and topics the media are covering, the trajectories of that media narrative and differences among news platforms.
Citation formats