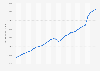
| Year | Per capita sales in U.S. dollars |
|---|---|
| 2022 | 21,127 |
| 2021 | 19,635 |
| 2020 | 16,788 |
| 2019 | 16,456 |
| 2018 | 16,081 |
| 2017 | 15,509 |
| 2016 | 15,009 |
| 2015 | 14,738 |
| 2014 | 14,578 |
| 2013 | 14,111 |
| 2012 | 13,709 |
| 2011 | 13,169 |
| 2010 | 12,343 |
| 2009 | 11,776 |
| 2008 | 12,941 |
| 2007 | 13,263 |
| 2006 | 12,975 |
| 2005 | 12,484 |
| 2004 | 11,861 |
| 2003 | 11,247 |
| 2002 | 10,877 |
| 2001 | 10,746 |
| 2000 | 10,573 |
The chart is not accessible to screen readers. Please switch to the table view to access the data.
Zoomable Statistic: Select the range in the chart you want to zoom in on.
Loading statistic...
Download
Source
Source
Release date
January 2024
More information
Region
United States
Survey time period
2000 to 2022
Supplementary notes
Estimates are shown in dollars and are based on data from the Annual Retail Trade Survey and Census Bureau's Population Estimates program.
NAICS code 44-45. (NAICS = North American Industry Classification System)
Estimates have been adjusted using final results of the 2017 Economic Census.
Citation formats