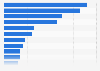
| Characteristic | Percentage of tweets |
|---|---|
| - | - |
| - | - |
| - | - |
| - | - |
| - | - |
| - | - |
| - | - |
| - | - |
| - | - |
| - | - |
| - | - |
| - | - |
| - | - |
The chart is not accessible to screen readers. Please switch to the table view to access the data.
Download
Source
Source
Release date
November 2011
More information
Region
United States
Survey time period
February 14-20, 2011
Supplementary notes
Researchers examined the Twitter feeds of 13 major U.S. news sources at three levels, including the main feed representing the news outlet (like @washingtonpost) as well as the feeds of the individual journalists who had the largest number of Twitter followers. In all, then, 37 different Twitter feeds were studied. A total of 3,646 tweets were examined from the week of February 14-20, 2011 (2,969 main organizational tweets and 677 journalist tweets.) In addition, that content was compared with 972 stories found on the original platforms of those news outlets from the same week.
Citation formats