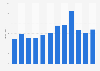
| Product category | Mix ratio |
|---|---|
| - | - |
| - | - |
| - | - |
| - | - |
| - | - |
| - | - |
| - | - |
The chart is not accessible to screen readers. Please switch to the table view to access the data.
Download
Source
Source
Release date
August 2011
More information
Region
United States
Survey time period
2010
Supplementary notes
*The overall Wood and Non-Wood product mix remains relatively constant at approximately 25% wood product and 75% non-wood product.
Citation formats