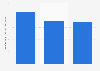


| Characteristic | Share of respondents |
|---|---|
| 搁别蝉迟补耻谤补苍迟/产补谤/肠补蹿茅 | 42.55% |
| Retailer (supermarket, mall, electronics store, etc.) | 45.48% |
| Recreation (movie theater, bowling alley, sporting event, etc.) | 24.59% |
| Financial (bank, credit card statement, ATM) | 35.27% |
| Exercise (gym, pool, hiking trail, track, etc.) | 19.4% |
| Business office/Place of work | 24.87% |
| Medical (doctor鈥檚 office, prescription drugs, hospital) | 33.55% |
| Travel (airport, taxi, ticket, etc.) | 20.56% |
| On a consumer product (on packaging, wrappers, physical hardware, as part of install, etc.) | 33.64% |
| Other (please specify) | 5.61% |
The chart is not accessible to screen readers. Please switch to the table view to access the data.
Loading statistic...
Download
Source
Source
Release date
September 2020
More information
Region
United Kingdom, United States
Survey time period
September 2020
Number of respondents
2,197 respondents
Supplementary notes
The total survey included the opinions of over 3,800 consumers across the United States, U.K., Germany, Netherlands and France.
Citation formats