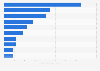
| Characteristic | Number of customers in millions |
|---|---|
| - | - |
| - | - |
| - | - |
| - | - |
| - | - |
| - | - |
| - | - |
| - | - |
| - | - |
| - | - |
| - | - |
| - | - |
| - | - |
| - | - |
| - | - |
| - | - |
| - | - |
| - | - |
| - | - |
The chart is not accessible to screen readers. Please switch to the table view to access the data.
January 2025
United States
2006 to 2024
at year end
*Methodology until 2013: generally, a dwelling or commercial unit with one or more television sets connected to a distribution system counts as one video customer. In the case of some multiple dwelling units (鈥淢DU鈥�), video customers are counted on an FCC equivalent basis by dividing total revenue received from a contract with an MDU by the standard residential rate where the specific MDU is located.
Beginning in 2014, the Cable Communications segment revised its methodology for counting customers related to how Comcast counts and reports customers who reside in multiple dwelling units ("MDUs") that are billed under bulk contracts (the "Billable Customers Method"). For MDUs whose residents have the ability to receive additional cable services, such as additional programming choices or HD or DVR services, Comcast now counts and reports customers based on the number of potential billable relationships within each MDU. For MDUs whose residents are not able to receive additional cable services, the MDU is now counted as a single customer. Video customer metrics for 2013 are now presented on the Billable Customers Method to provide an appropriate comparison.
Figures prior to 2021 come from Comcast's earlier financial releases.
Figures have been rounded.