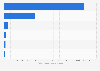
| Characteristic | Production in thousand tons |
|---|---|
| 2024/25 | 2,245 |
| 2023/24 | 2,502 |
| 2022/23 | 2,312 |
| 2021/22 | 3,108 |
| 2020/21 | 3,980 |
| 2019/20 | 4,766 |
| 2018/19 | 4,923 |
| 2017/18 | 3,515 |
| 2016/17 | 4,616 |
| 2015/16 | 5,523 |
| 2014/15 | 5,763 |
| 2013/14 | 6,140 |
| 2012/13 | 7,501 |
| 2011/12 | 8,166 |
| 2010/11 | 8,078 |
| 2009/10 | 7,478 |
| 2008/09 | 8,281 |
| 2007/08 | 9,141 |
| 2006/07 | 6,917 |
| 2005/06 | 8,212 |
| 2004/05 | 8,419 |
| 2003/04 | 11,734 |
| 2002/03 | 10,527 |
| 2001/02 | 11,290 |
| 2000/01 | 11,139 |
The chart is not accessible to screen readers. Please switch to the table view to access the data.
Loading statistic...
Download
Source
Sources
Release date
December 2025
More information
Region
United States
Survey time period
2000/01 to 2024/25; Marketing years
Supplementary notes
* Year harvest was complete.
For some crops in certain years, production includes some quantities unharvested for economic reasons or excess cullage fruit.
Figure for 2000 is quoted from Agricultural Statistics 2010.
Data prior to 2020 have been taken from previous reports.
Citation formats