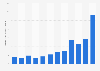
| Characteristic | Production value in thousand U.S. dollars |
|---|---|
| 2025 | 1,599,282 |
| 2024 | 2,133,360 |
| 2023 | 1,780,808 |
| 2022 | 1,842,922 |
| 2021 | 1,324,944 |
| 2020 | 958,393 |
| 2019 | 1,001,986 |
| 2018 | 886,941 |
| 2017 | 1,042,090 |
| 2016 | 1,059,318 |
| 2015 | 993,360 |
| 2014 | 892,325 |
| 2013 | 969,170 |
| 2012 | 942,340 |
| 2011 | 742,236 |
| 2010 | 1,049,704 |
| 2009 | 1,054,227 |
| 2008 | 834,386 |
| 2007 | 816,061 |
| 2006 | 1,084,099 |
| 2005 | 839,773 |
| 2004 | 669,514 |
| 2003 | 928,907 |
| 2002 | 764,994 |
| 2001 | 680,350 |
| 2000 | 735,939 |
The chart is not accessible to screen readers. Please switch to the table view to access the data.
Loading statistic...
Download
Source
Sources
Release date
March 2026
More information
Region
United States
Survey time period
2000 to 2025
Supplementary notes
Price and value at point of first sale. Mostly for fresh market use, but includes some quantities used for processing. Includes storage crop onions harvested but not sold because of shrinkage and loss.
Citation formats