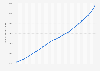
| Characteristic | Number of employees in thousands |
|---|---|
| - | - |
| - | - |
| - | - |
| - | - |
| - | - |
| - | - |
| - | - |
| - | - |
| - | - |
| - | - |
| - | - |
| - | - |
| - | - |
| - | - |
| - | - |
| - | - |
| - | - |
| - | - |
| - | - |
| - | - |
| - | - |
| - | - |
| - | - |
| - | - |
| - | - |
| - | - |
| - | - |
The chart is not accessible to screen readers. Please switch to the table view to access the data.
Download
Source
Source
Release date
September 2025
More information
Region
United States
Survey time period
1998 to 2024
Supplementary notes
* Including ambulatory health care services, hospitals and nursing and residential care facilities, social assistance. Including full-time and part-time employees.
Estimates in this statistic are based on the 2002 North American Industry Classification System (NAICS).
Citation formats