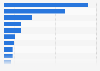
| Characteristic | Share of respondents |
|---|---|
| - | - |
| - | - |
| - | - |
| - | - |
| - | - |
The chart is not accessible to screen readers. Please switch to the table view to access the data.
May 2009
United States
March 10-18, 2009
200 respondents
21 years and older
Interviewees were travel and tourism experts*
Telephone interviews and online survey
* The source does not provide detailed information regarding the questions. The chosen wording here might therefore differ slightly from the survey. Answers were based on a scale from 1 (not important at all) to 5 (extremely important) All respondents are executive-level officials at convention and visitor bureaus, destination marketing organizations, city and state tourism offices, and state economic development offices among others. The margin of error for the total sample is +/- 3.5 percent.