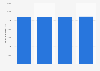
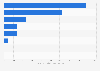
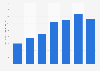
| Characteristic | Demand in billion gallons |
|---|---|
| 2023 | 141.82 |
| 2022 | 139.29 |
| 2021 | 139.94 |
| 2020 | 127.71 |
| 2019 | 146.29 |
| 2018 | 145.24 |
| 2017 | 144.58 |
| 2016 | 144.85 |
| 2015 | 141.33 |
| 2014 | 140.01 |
| 2013 | 135.14 |
| 2012 | 134.58 |
| 2011 | 135.15 |
| 2010 | 137.71 |
| 2009 | 136.75 |
| 2008 | 136.02 |
| 2007 | 139.9 |
| 2006 | 139.78 |
| 2005 | 139.99 |
| 2004 | 141.18 |
| 2003 | 138.61 |
| 2002 | 137.26 |
| 2001 | 133.74 |
| 2000 | 131.86 |
| 1999 | 131.78 |
| 1998 | 127.98 |
| 1997 | 124.33 |
| 1996 | 122.69 |
| 1995 | 120.25 |
| 1994 | 118.72 |
| 1993 | 116.58 |
| 1992 | 114.88 |
| 1991 | 112.22 |
| 1990 | 113.61 |
The chart is not accessible to screen readers. Please switch to the table view to access the data.
Zoomable Statistic: Select the range in the chart you want to zoom in on.
Loading statistic...
Download
Source
More information
Region
United States
Survey time period
1990 to 2023
Supplementary notes
The values refer to the following modes: highway, agriculture, aviation (jet fuel excluded), marine, and other (includes state, county, and municipal use, industrial and commercial use, construction use, and miscellaneous).
All nonhighway uses of gasoline were estimated by the U.S. Department of Transportation, Federal Highway Administration.
The values have been rounded.
Citation formats